Modal title
One fine body…
October 10, 2018
2018Õs Best Foodie Cities in America
|
Naturally, the foodie lifestyle can be quite expensive, considering that restaurant prices rose 2.8% just between July 2017 and July 2018. And in 2015, Americans spent more money at food establishments than at grocery stores for the first time. In 2018, restaurants have been able to profit from relatively stable wholesale food prices, especially with beef and pork. And while people may view dining at home to be more cost-effective, eating at home still can be pricey, depending on the local cost of living as well as the type and quality of ingredients used. Fortunately, culinary hotspots across the U.S. offer plenty of affordable options for cash-strapped foodies. These wallet-friendly cities cater to diners who prefer to cook at home, explore the local flavors or both. To determine the best and cheapest foodie scenes, WalletHub compared more than 180 U.S. cities across 29 key indicators of foodie-friendliness. Our data set ranges from cost of groceries to affordability and accessibility of high-quality restaurants to food festivals per capita. Read on for the winners, expert foodie insight and a full description of our methodology. Main Findings Source: WalletHub
Best Food Cities in America 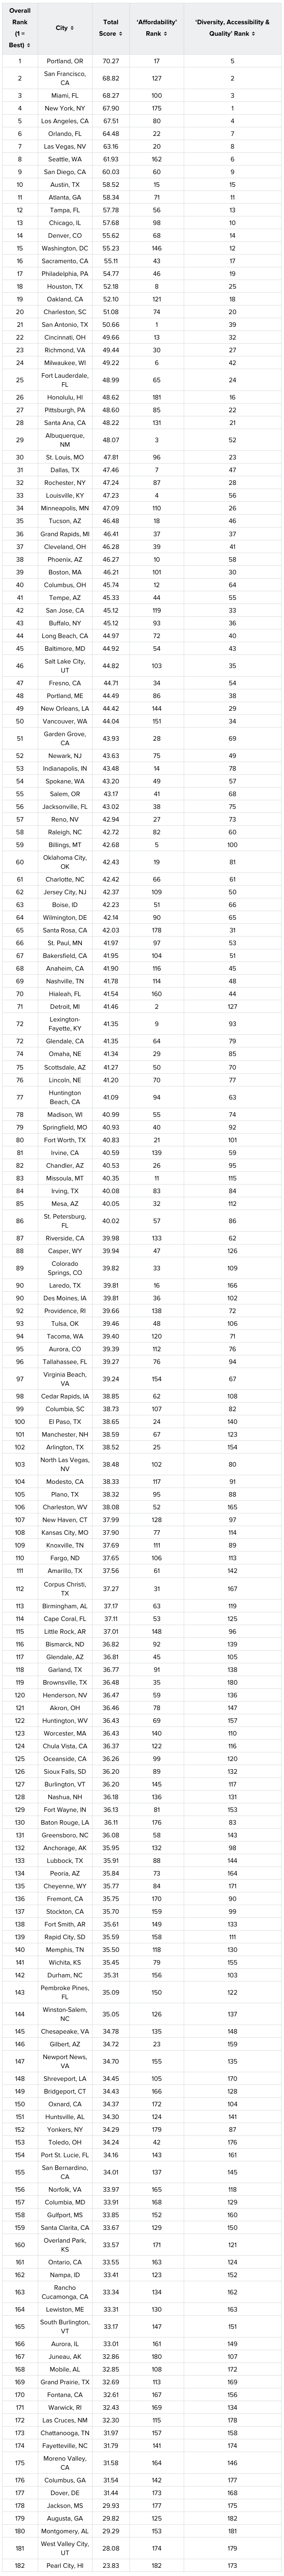 Methodology In order to determine the best and cheapest local foodie scenes, WalletHub compared 182 cities - including the 150 most populated U.S. cities, plus at least two of the most populated cities in each state - across two key dimensions, "Affordability" and "Diversity, Accessibility & Quality. We evaluated those dimensions using 29 relevant metrics, which are listed below with their corresponding weights. Each metric was graded on a 100-point scale, with a score of 100 representing the most favorable conditions and costs for foodies. For metrics marked with an asterisk (*), we used the square root of the population to calculate the population size in order to avoid overcompensating for minor differences across cities. Finally, we determined each city's weighted average across all metrics to calculate its overall score and used the resulting scores to rank-order the cities in our sample. In determining our sample, we considered only the "city proper" in each case and excluded surrounding cities in the metro area. Copyright 2018 Evolution Finance, Inc. All rights reserved. From https://wallethub.com.
By Adam McCann, Financial Writer. |
To view all articles, check out the Internet Travel Monitor Archive